purple gradient pie chart graph – 1
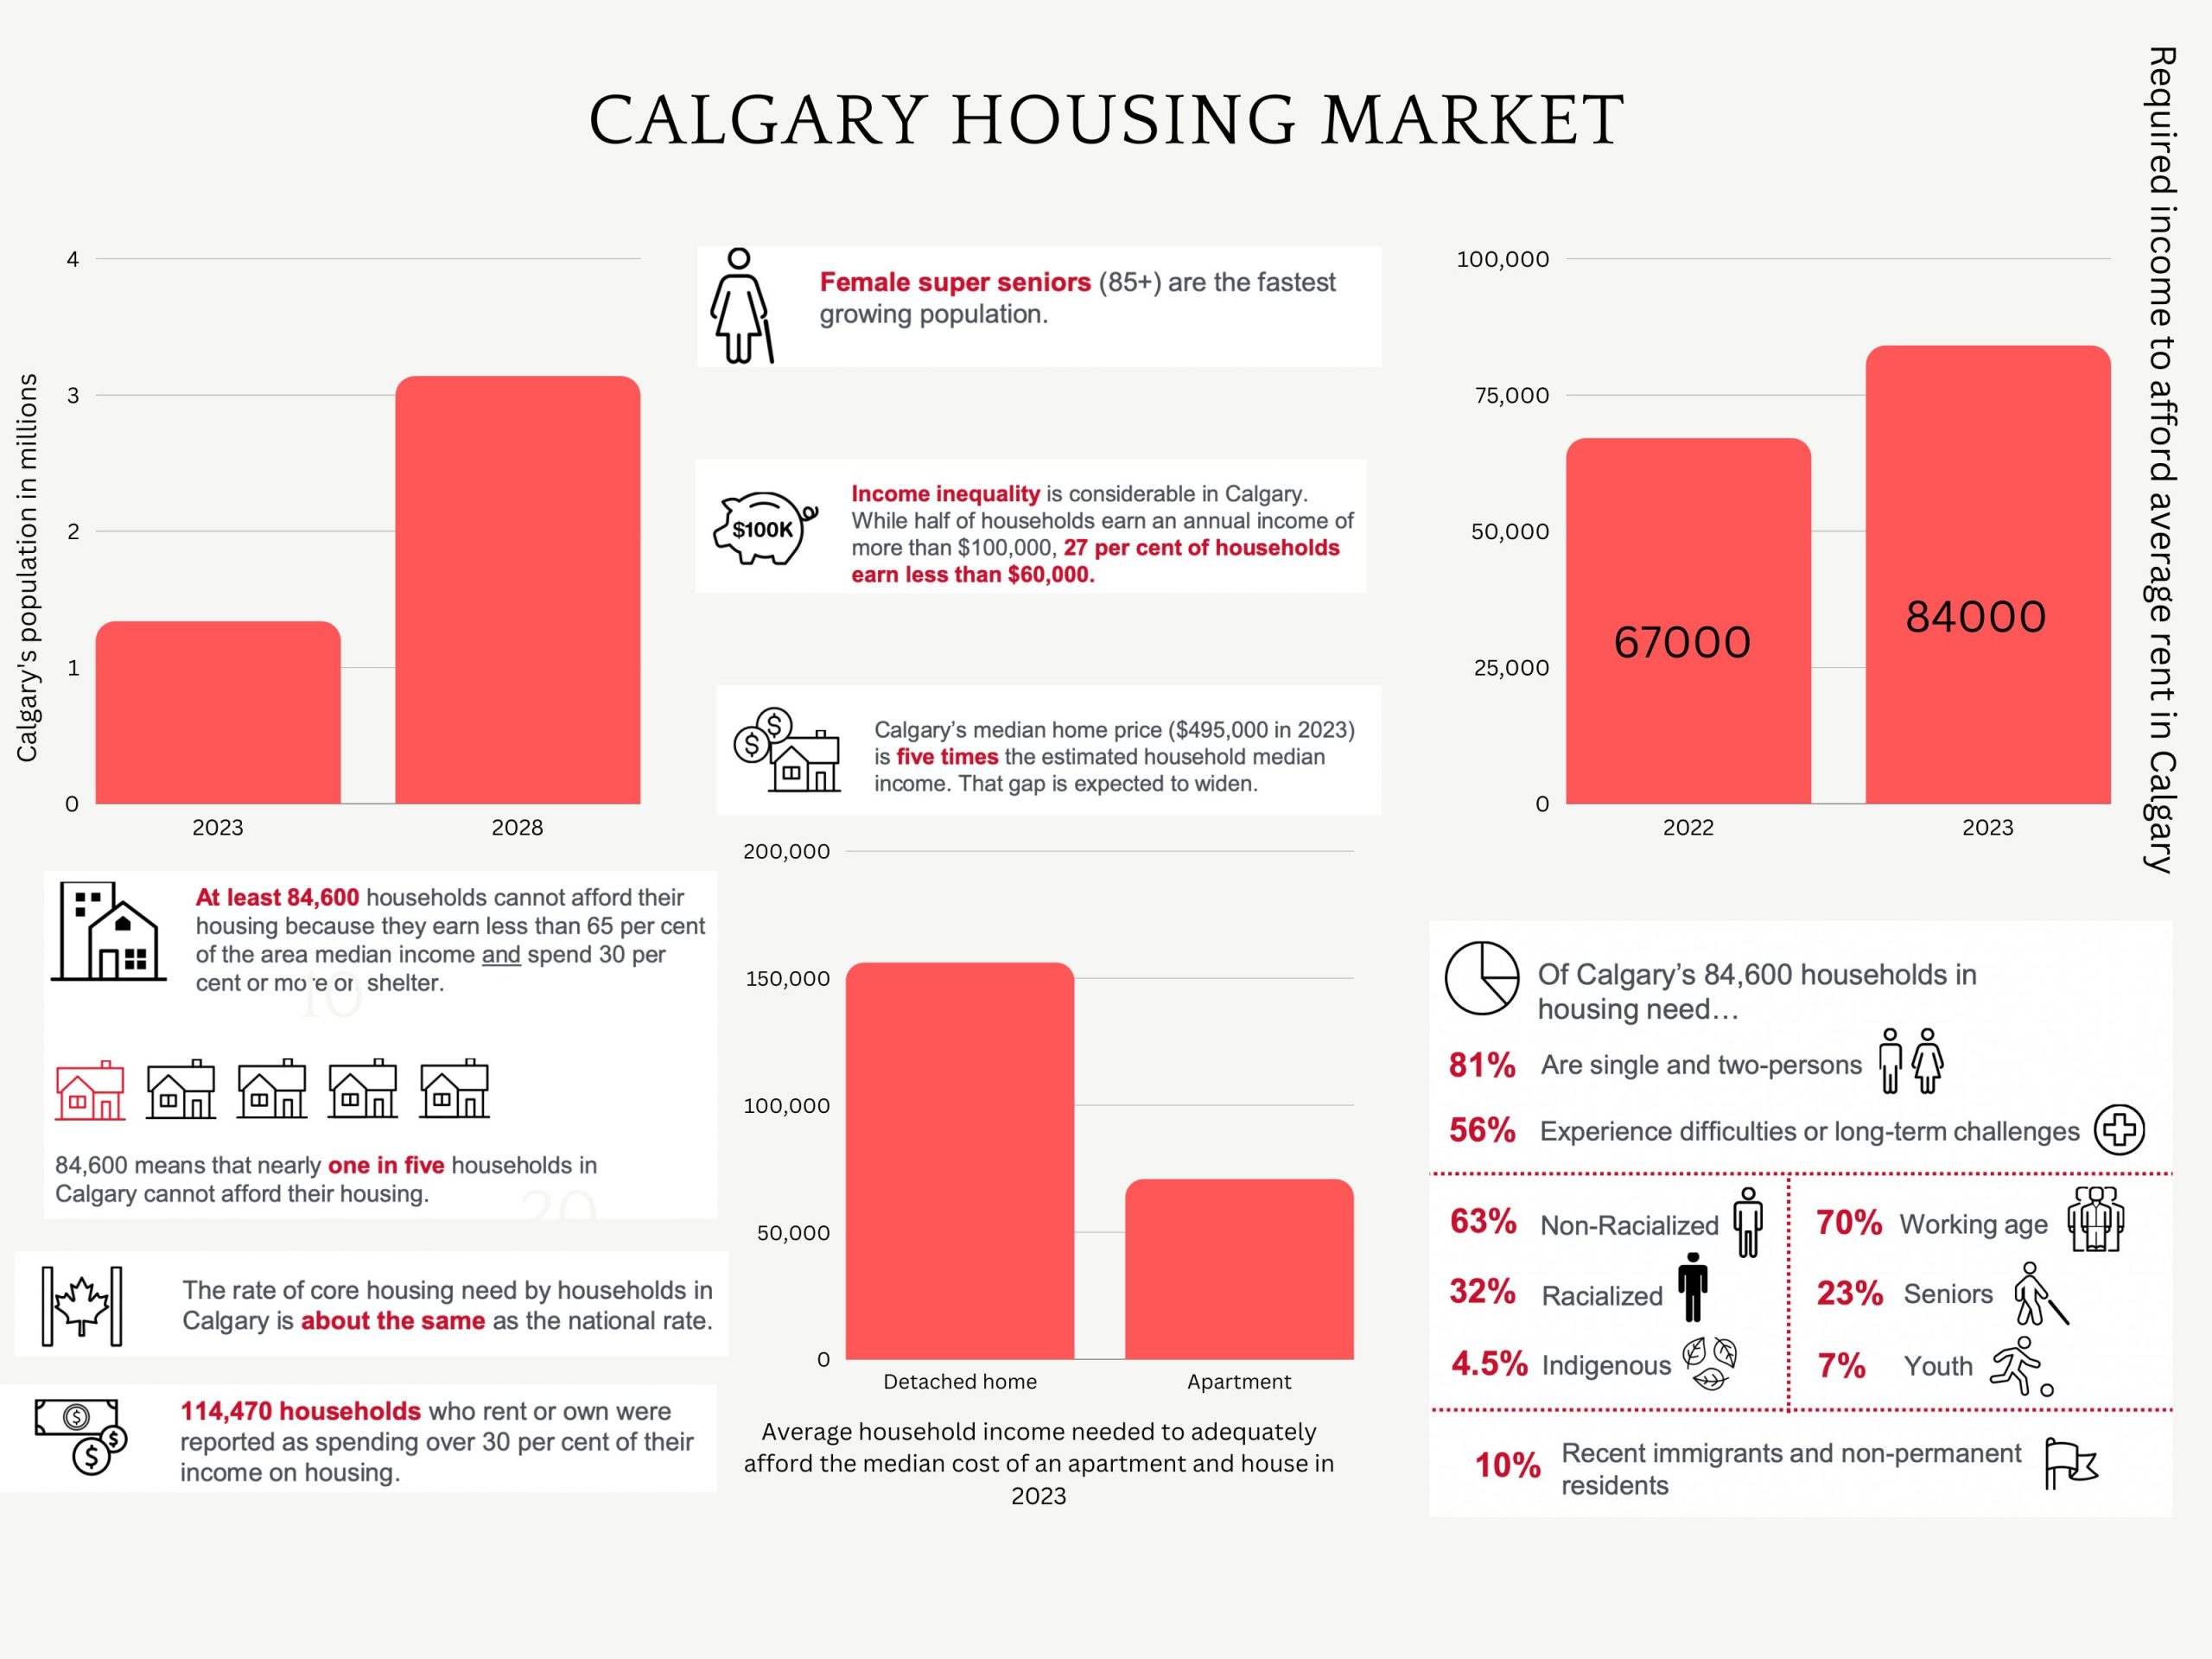
A graph representing and comparing CalgaryÕs housing market from 2020 and 2023.
A graph representing and comparing CalgaryÕs housing market from 2020 and 2023.
Copyright © 2026 | MH Magazine WordPress Theme by MH Themes